Histological Analysis
|
|||||
|
Introduction Disclosure of findings and
contributions to human resources |
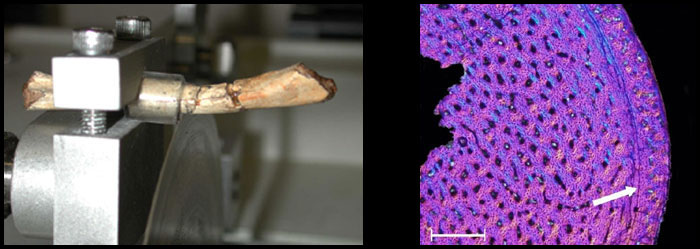
Histological ProcessingWe are making histological thin sections of femoral (thighbone) mid-diaphyses (mid-shaft) for each taxon outlined above. All thin-sections are viewed under polarized light to reveal annual growth lines. (Fig. 3). |
||||
 |
|||||
| Figure 3. Histological processing of a femur from the non-avian dinosaur Shuvuuia (left; AMNH 100/99). Histological section from the same specimen viewed with polarized light microscopy (right) from Erickson, Curry Rogers and Yerby, 2001. The arrow indicates a growth line used to assess longevity. The histological suite indicates a primary bone cortex formed from a fibro-lamellar complex, with longitudinal vascularization, interrupted by lines of arrested growth and showing endosteal osteoclastic activity. Scale = 0.4 mm. | |||||
|
Quantitative Bone Growth Patterns For taxa represented by ontogenetic (developmental) series (e.g., Struthiomimus, Troodon, Caudipteryx), femoral thin sections are being made spanning the series and will allow longevity estimation for each growth stage (Ricqlès 1983, Chinsamy 1990, Varricchio 1993, Erickson and Brochu 1998, Curry 1999). The loss of growth cycles effaced by medullar expansion are accounted for by sequentially superimposing digitized images (NIH Image Software, Bethesda MD) of juvenile and sub-adult diaphyses upon those from larger individuals (Chinsamy 1990, Erickson and Tumanova 2000). Small birds (e.g., as may occur in Confuciusornis, Zhang et al. 1998) commonly lack growth line formation because they acquire their entire somatic complement in less than a year (Starck and Ricklefs 1998). In these cases, longevity estimates for different growth stages can be derived solely from histological patterns (Amprino 1947, 1948; Castanet et al., 1996, 2000, 2001; Fig. 4). |
|||||
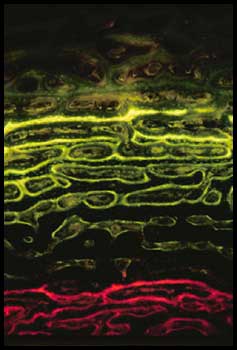 |
Figure 4. Histological section of a periodically labeled ostrich (Struthio camelus) used to verify the efficacy of Amprino's Rule for quantifying bone tissue growth in precocial birds. Amrpino's Rule relates primary bone tissue formation rates to bone tissue type, and allows assessment of longevity directly from bone tissue. Here a juvenile ostrich femur has been marked successively with xylenol orange (orange) and fluorescein (DCAF, green). Growth lines do not occur in this laminar bone tissue, but the fluorescent labels allowed Castanet et al. (2000) to accurately relate bone tissue typology and growth rates. Similar methods can be employed in fossil taxa for which bone appositional patterns are clearly demonstrated. Photo courtesy of K. Curry Rogers. | ||||