GROWTH CURVE RECONSTRUCTION AND DEVELOPMENTAL MASS
EXTRAPOLATION
|
|||||
|
Introduction |
Growth series, longevity estimates, and size changes are being coupled to yield growth curves and overall developmental patterns for the dinosaurs and birds in our sample (Erickson and Brochu 1998, Erickson and Tumanova 2000, Erickson et al. 2001). Adult body mass of the largest members of each growth series are determined using mid-diaphyseal circumference measures and the interspecific regression equations of Anderson et al. (1985). The proportions of sub-adult femoral values relative to the adult values are utilized to reveal sub-adult masses. A matching of longevity with mass for each species reveals S-shaped curves, as found in all living vertebrates (Sussman 1964, Purves et al 1992; Fig. 5). | ||||
 |
|||||
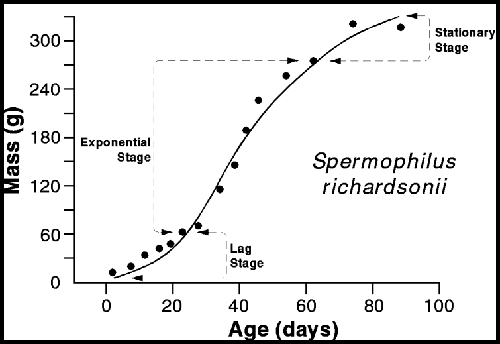
| Figure 5. Typical vertebrate growth curve. Based on neontological data from Zullinger et al. (1984). The three characteristic growth stages are represented. An initial slow growth lag phase is followed by the rapid growth exponential stage when the majority of mass is accrued. The ontogenetic trajectory culminates in a reduction or cessation of growth late in development during the stationary phase (Sussman, 1964). | |||||
|
Sigmoidal equations are fitted to these data using least squares regression analysis (Zullinger et al. 1984, Erickson et al. 2001). Maximal growth rates are assessed during the exponential developmental stage (steepest portion of the curves). This key stage of growth is the physiological standard for interspecific comparative analysis of growth potential (Case 1978, Calder 1984; Figs. 2,5). Exponential body growth rates are converted to daily values (g/day) after division by the appropriate number of days in the Mesozoic for each taxon (there were more days in the year than there are at present, Wells 1963) to result in a summary of overall body growth occurring per day in each taxon under scrutiny. |
|||||