Next topic Previous Topic Table of Contents
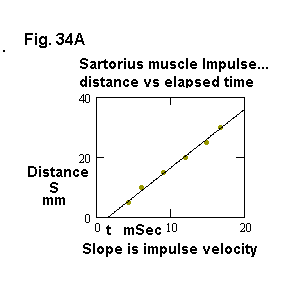
Fig. 34A. Sartorius AP velocity calculated from latency at different distances.
| Each distance was set, and the corresponding AP was recorded, following a single stimulus pulse at S. Operationally, the distance is therefore the independent, and latency to spike the dependent variable, because the latency depends of the distance. Mathematically, the independent variable is customarily represented by the X, horizontal axis, in an X-Y plot. The velocity is defined as the slope of a curve showing distance as a function of time, so the plot is constructed to show elapsed time as the independent variable. By using many points, we reduce the error that would arise if the time between only two points were used. The velocity in this instance is about 2 m/sec. Compare with nerve impulse velocity (Topic 23). | ||
|
||