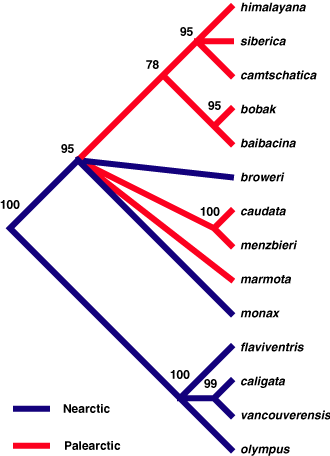
1999. Molecular phylogeny of the marmots (Rodentia: Sciuridae): tests of evolutionary and biogeographic hypotheses. Steppan, Scott. J., Mikhail R. Akhverdyan, Elena A. Lyapunova, Nikolai N. Vorontsov, Darrilyn G. Fraser, Robert S. Hoffmann, and Michael J. Braun. Systematic Biology 48(4):715-734.

Download pdf here.


Fig. 1. Marmota flaviventris (yellow-bellied marmot) standing guard in Kings Canyon National Park, California. Copyright Scott Steppan.
Abstract. There are 14 species of marmots distributed across the Holarctic, and despite extensive systematic study, their phylogenetic relationships remain largely unresolved. In particular, comprehensive studies have been lacking. To address this situation, we obtained complete cytochrome b sequence for all 14 species. We employed a statistical approach to both phylogeny estimation and hypothesis testing using parsimony and maximum likelihood based methods. A sequential phylogenetic estimation procedure was used that culminated in a maximum likelihood analysis using an evolutionary model and parameters estimated from the data. We conducted statistical tests on a suite of previously proposed hypotheses of phylogenetic relationships and biogeographic histories. The cyt b data support strongly the monophyly of Marmota and a western montane clade in the Nearctic. The results are consistent with an initial diversification in North America followed by an invasion and subsequent rapid diversification in the Palearctic. The Alaska species M. broweri appears to be a reinvasion from Asia. These analyses reject strongly the two major competing hypotheses of broweri's phylogenetic relationships: namely, that it is the sister species to camtschatica of eastern Siberia and that it is related closely to caligata of the Nearctic. Several other conventionally recognized species groups can also be rejected. Social evolution has been homoplastic, with large colonial systems having been evolved in two groups convergently. The cyt b data are equivocal regarding some aspects of pelage and karyotypic evolution.

Fig. 2. This cladogram is based on a maximum likelihood analysis of the complete cytochrome b gene (1140 bp) using a general time reversable (GTR) model with estimated proportion of invariable sites (I) and gamma distribution. Numbers above branches represent bootstrap percentages. Poorly supported nodes have been collapsed.